April 2025 DMV Housing Market Update: Rising Prices and Inventory Signal Strong Spring Market
The Washington, D.C. metropolitan area real estate market is showing significant strength as we move through spring 2025, with notable price increases across all counties and a substantial rise in available inventory compared to this time last year. This comprehensive analysis examines the latest market data for Arlington County, Fairfax County, Loudoun County, Montgomery County, and Washington, D.C. proper.
Key Takeaways
- Average sales prices have increased across all localities year-over-year, with Washington D.C. leading at an impressive 18% jump
- Available inventory has surged dramatically in all areas, with active listings up 25-77% compared to April 2024
- Days on market trends vary significantly by location, reflecting different market dynamics in each county
- New listings are consistently up across the region, indicating renewed seller confidence
Arlington County: Premium Pricing with Faster Sales
Arlington County continues to command premium prices, with the average home selling for $996,114, representing a solid 10% increase from April 2024. What’s particularly noteworthy is that homes are selling faster year-over-year, with average days on market dropping from 22 to just 16 days—a 27% decrease.
While sales volume has declined 13% with 220 properties sold, the market is seeing a remarkable 31% increase in new listings (399) and a 70% surge in active listings (545). This suggests sellers are responding to strong price appreciation, bringing more inventory to the market while buyers continue to act quickly on desirable properties.
Fairfax County: Balanced Growth and Strong Inventory
Fairfax County, the region’s largest housing market by volume, shows a balanced market with average sales prices reaching $897,639, an 8% year-over-year increase. The county saw 1,150 properties sold (down 3% from last year), but homes are selling slightly faster at 14 days on market (7% improvement).
Most striking is the 68% increase in active listings, now standing at 2,112 properties, paired with a 27% increase in new listings (2,002). This substantial inventory growth provides buyers with more options while still maintaining price appreciation—a relatively balanced market compared to some neighboring counties.
Loudoun County: Stable Days on Market with Growing Inventory
Loudoun County’s housing market demonstrates remarkable stability in some aspects while showing growth in others. The average sales price has reached $913,146, an 8% year-over-year increase, while properties sold increased by 4% to 481 homes.
Days on market remained unchanged at 16 days, but the county experienced a significant 23% increase in new listings (826) and a dramatic 74% surge in active listings (960). This pattern suggests a market transitioning toward better supply-demand balance, though strong demand is maintaining sales pace and price growth.
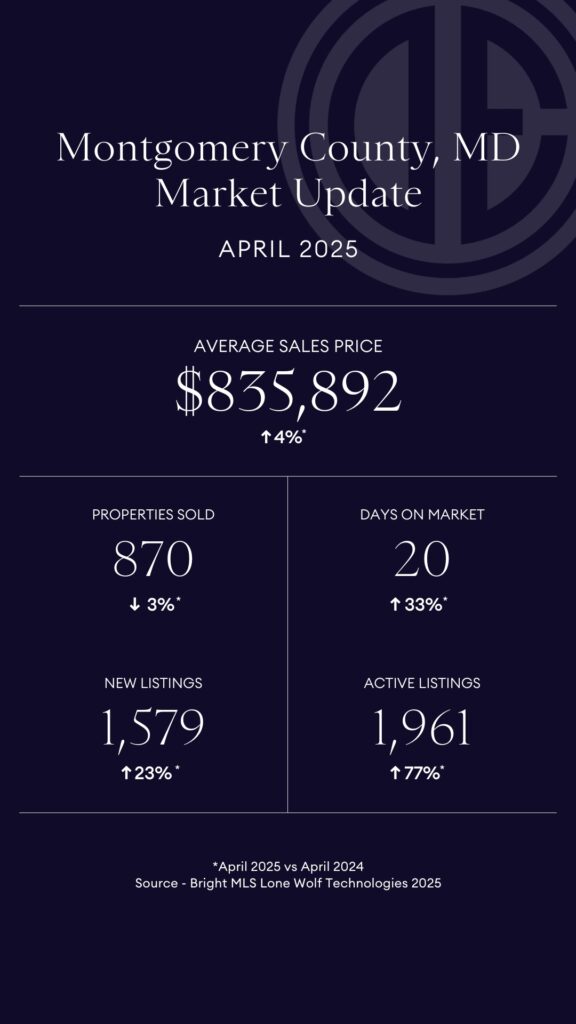
Montgomery County: Longer Selling Times Despite Price Growth
Montgomery County presents an interesting contrast, with the average sales price increasing a modest 4% to $835,892, while days on market increased significantly by 33% to 20 days. Property sales decreased slightly by 3% to 870 homes.
The county has seen a robust 23% increase in new listings (1,579) and a substantial 77% increase in active listings (1,961). This data indicates a shifting market where buyers may have more negotiating power and options, though prices continue to appreciate, albeit at a slower rate than neighboring Virginia counties.
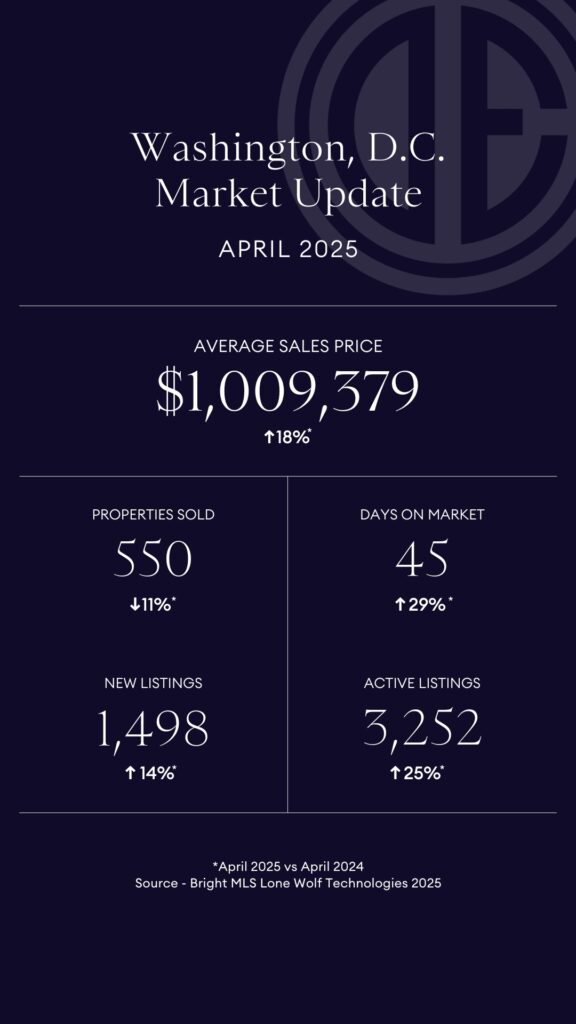
Washington, D.C.: Highest Price Growth but Slower Sales Pace
The District of Columbia shows the most dramatic price increases in the region, with average sales prices soaring 18% to $1,009,379—crossing the million-dollar threshold. However, this comes with a 29% increase in days on market (now 45 days) and an 11% decrease in properties sold (550).
New listings increased by 14% to 1,498, while active listings rose by 25% to 3,252. This data suggests a more complex market in D.C., where premium pricing may be extending selling times, but strong demand for the limited housing stock in the nation’s capital continues to drive significant price appreciation.
Regional Trends and Analysis
Several important trends emerge when analyzing the data across all five localities:
Inventory surge: Active listings are up dramatically across the board (25-77%), representing the most significant inventory increase in recent years.
Price resilience: Despite more inventory, prices continue to rise in all areas (4-18%), indicating sustained buyer demand even with more options.
Market speed varies: Arlington and Fairfax homes sell fastest (14-16 days), while D.C. properties take significantly longer (45 days).
Seller confidence: New listings are consistently up (14-31%), showing that homeowners are increasingly willing to list their properties.
Geographic differences: Virginia counties generally show stronger performance metrics than Maryland or D.C., potentially reflecting employment patterns, school districts, or taxation differences.
What This Means for Buyers and Sellers
For sellers: The market remains favorable with strong price appreciation, but the surge in inventory means proper pricing and presentation are increasingly important. The days of automatic bidding wars may be waning in some neighborhoods, but well-priced homes in desirable locations continue to sell quickly.
For buyers: More inventory provides better options and potentially less competition, but prices continue to rise across the region. The increased days on market in some areas may provide more room for negotiation, especially in D.C. and Montgomery County.
Looking Ahead: Summer 2025 Forecast
As we move deeper into 2025, we anticipate the following trends:
- Continued but moderating price growth as inventory levels stabilize
- Interest rate sensitivity will remain a key factor influencing buyer activity
- Neighborhood-specific variations will become more pronounced as inventory grows
- New construction delivery will further impact the resale market, particularly in Loudoun and Fairfax
For personalized guidance on navigating this dynamic market, contact DC Prime Homes today. Our team of expert agents provides hyperlocal insights to help you make informed decisions in this evolving market landscape.
Data source: Bright MLS/Lone Wolf Technologies, April 2025 vs. April 2024
This market analysis was prepared by DC Prime Homes, your trusted real estate advisory team for the Washington metropolitan area.